About
The Project
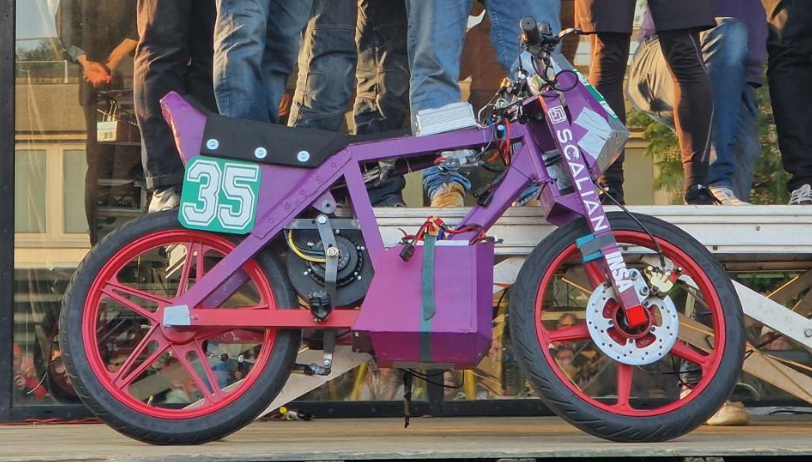
The Scal'n Solex project involves tracking the performance of an electric Solex during a race. Fitted with sensors, the Solex continuously transmits data to the supervision application, which processes and displays them on the stand.
Our aim is to bring new functionalities to this application :
- Automatically count the number of laps completed by the solex
- Detect when a driver change occurs and identify the current driver
- Monitor rider fatigue by analyzing heart rate data while on the solex
Features
Added Features
Lap change detection
Just like in Formula 1, we had to detect when the solex had completed a lap. The information linked to this lap is then stored in the database and displayed on the stand during the race.
This lap detection makes it possible to display a number of statistics that are useful to the team:
- Time taken for each lap.
- The best time for a given driver.
- The fastest driver.
- The best, worst and average time of a lap.
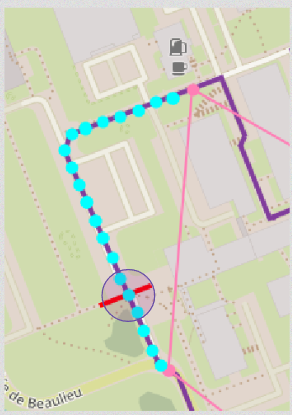
These measurements are based on real-time detection of the solex's position on the circuit. The data is measured using a GPS device mounted on the vehicle and is resistant to imprecision. If the signal is lost, the algorithm automatically detects the path taken, assuming the position of the solex.
Driver change detection
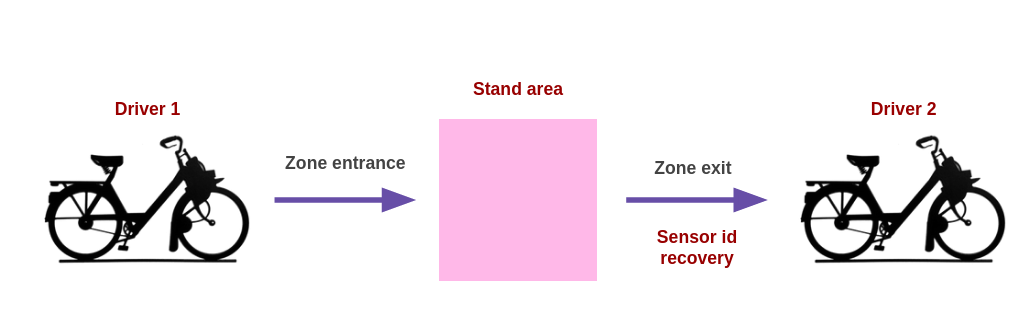
Our second objective is to detect driver changes during solex pit stops.
We detect driver changes based on several criteria that follow the rules of the race, and the race strategy of the Scalian team.
- Each rider wears a cardiac sensor with a different identifier. This sensor connects to the solex's phone, and the data measured is sent continuously.
- We also use GPS data to confirm that the solex is in the pit area, where driver changes take place.
Pilot's state
Thanks to cardiac sensors, the heart rate of the pilot is sent to the backend where we process it live. With a second MQTT broker at our disposal, we build a new processing pipeline similar to those already existing.
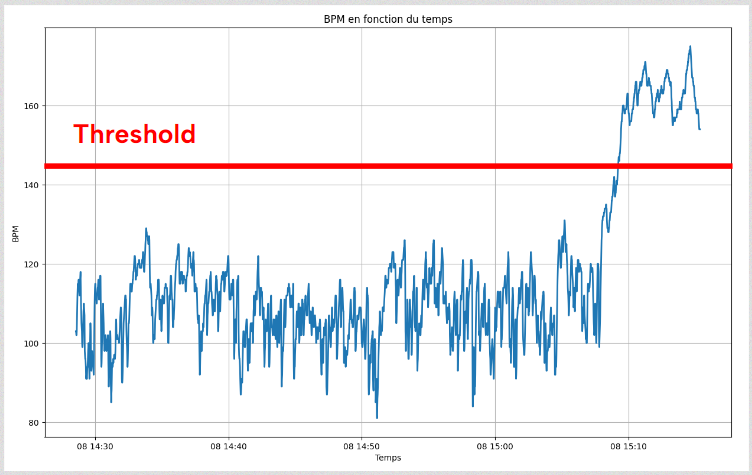
We then determine the state of the pilot by using those cardiac data. This is possible for us thanks to a Scalian in-house study on the correlation of tiredness and heart rate.
To do so, we use a threshold that can be calculated as follows :
- Threshold = (220 - age) x 0.7
Exceeding the threshold for more than 5 minutes is the sign that the pilot is in a state of physical hardship.
Finaly, the heart rate as well as the pilot's state are sent to the frontend to be displayed in the stand.
Used Technologies


Team
Our Team

Antoine Blasco

Jules Chaidron

Benjamin Giraud-Renard

Gabriel Gyors

Romain Le Metayer
