The project

TSExplanation

TSExplanation is incorporated in the framework of the engineering training at the INSA in Rennes. It has been made by a group of eight second-year IT students and goes through the whole 2018-2019 academic year.

The topics addressed are those of Machine Learning, and more specifically the classification of time series.

The result returned by a classifier never includes any explanation. The human being cannot know the reasons why the classifier has chosen this result. An explanation could provide more confidence in such a tool.

The aim of this project is to implement a tool able to explain a decision made by a time series classifier. This explanation must be clear and quite simple in order to be understandable by any user.

To make this goal easier to understand, we can take the example of a classifier that decides if a patient has a heart disease from electrocardiograms. If a doctor uses such classifier, he would like to trust the decision made by his tool. To do so, the doctor would eventually like to be able to ask the tool to explain the classification choice (the diagnosis of the disease).

The features

TSExplanation can train a classifier from a training set of annotated time series. The tool can also save such a classifier so that it can be used on new time series later.

The tool has a graphical interface which allows a user to visualize the data (time series) (s)he wants to classify.
The TSExplanation's graphical interface allows a user to select a time series and a particular Shapelet and to see the distance between both elements.
The tool can explain a classification choice thanks to its adjustment of the algorithm LIME.


Training and saving a time series classifier

A classification problem involves assigning classes to some data. The point is to highlight some differences between these data.
A classifier is a tool that can be used to solve such a problem.

First of all, a classifier needs to be given some examples to base its work on, that is to say some data for which we already know the corresponding classes. Such data are called "annotated data". This step is the training phase of the classifier.

Using TSExplanation, a time series classifier can be trained and saved so that it can be used later.
Two different types of classifiers can be trained : one of them is based on the 1NN-DTW algorithm and the other one is based on Learning Shapelet. In order to train such classifiers, some training sets of time series can be imported by the user. This importation can be done with one the two following methods :

  • 1NN-DTW classifier :
  • When a new time series has to be classified, it will be compared with the time series from the training set by the classifier. This work is done by measuring the distance between each time series from the training set and the one the user wants to classify.
    The time series to classify will then be assigned to the same class as the time series from the training set the closest to itself.

  • Learning Shapelet classifier :
  • This classifier is based on a more complex algorithm, called Learning Shapelet.
    This algorithm is based on the analysis of the most characteristic time sub-series of each class. To be considered as characteristic as of a class, a sub-series needs to be present inside the time series that belong to this class but not inside those that belong to other classes.
    These sub-series are called Shapelets.
    The classification of a new time series will be based on these different Shapelets.

Once a classifier has been trained, it can be saved in a file from which it can be taken by the user when needed.


Displaying a time series

A time series is a row of values measured during a given period of time. This duration and the time interval between each measure can vary.
Here are some examples of time series:

  • an electrocardiogram
  • the evolution of the population in a precise area during a given period of time
  • a list of temperatures measured during a given duration

Such data can be represented in a graph to make them more readable for a human being.

The TSExplanation tool holds a graphical interface to make the user’s work easier. Therefore, the user can display any time series in the form of a graph.


Displaying the distance between a Shapelet and a time series

The TSExplanation graphical interface also allows the user to display a time series as well as any Shapelet and to view the minimal distance between both elements.

The user can therefore know the part of the time series that looks like the Shapelet the most. He then can determine by himself, visually, if the Shapelet can be considered as being part of the time series or not.


Classifying a time series and displaying the explanation of the classification

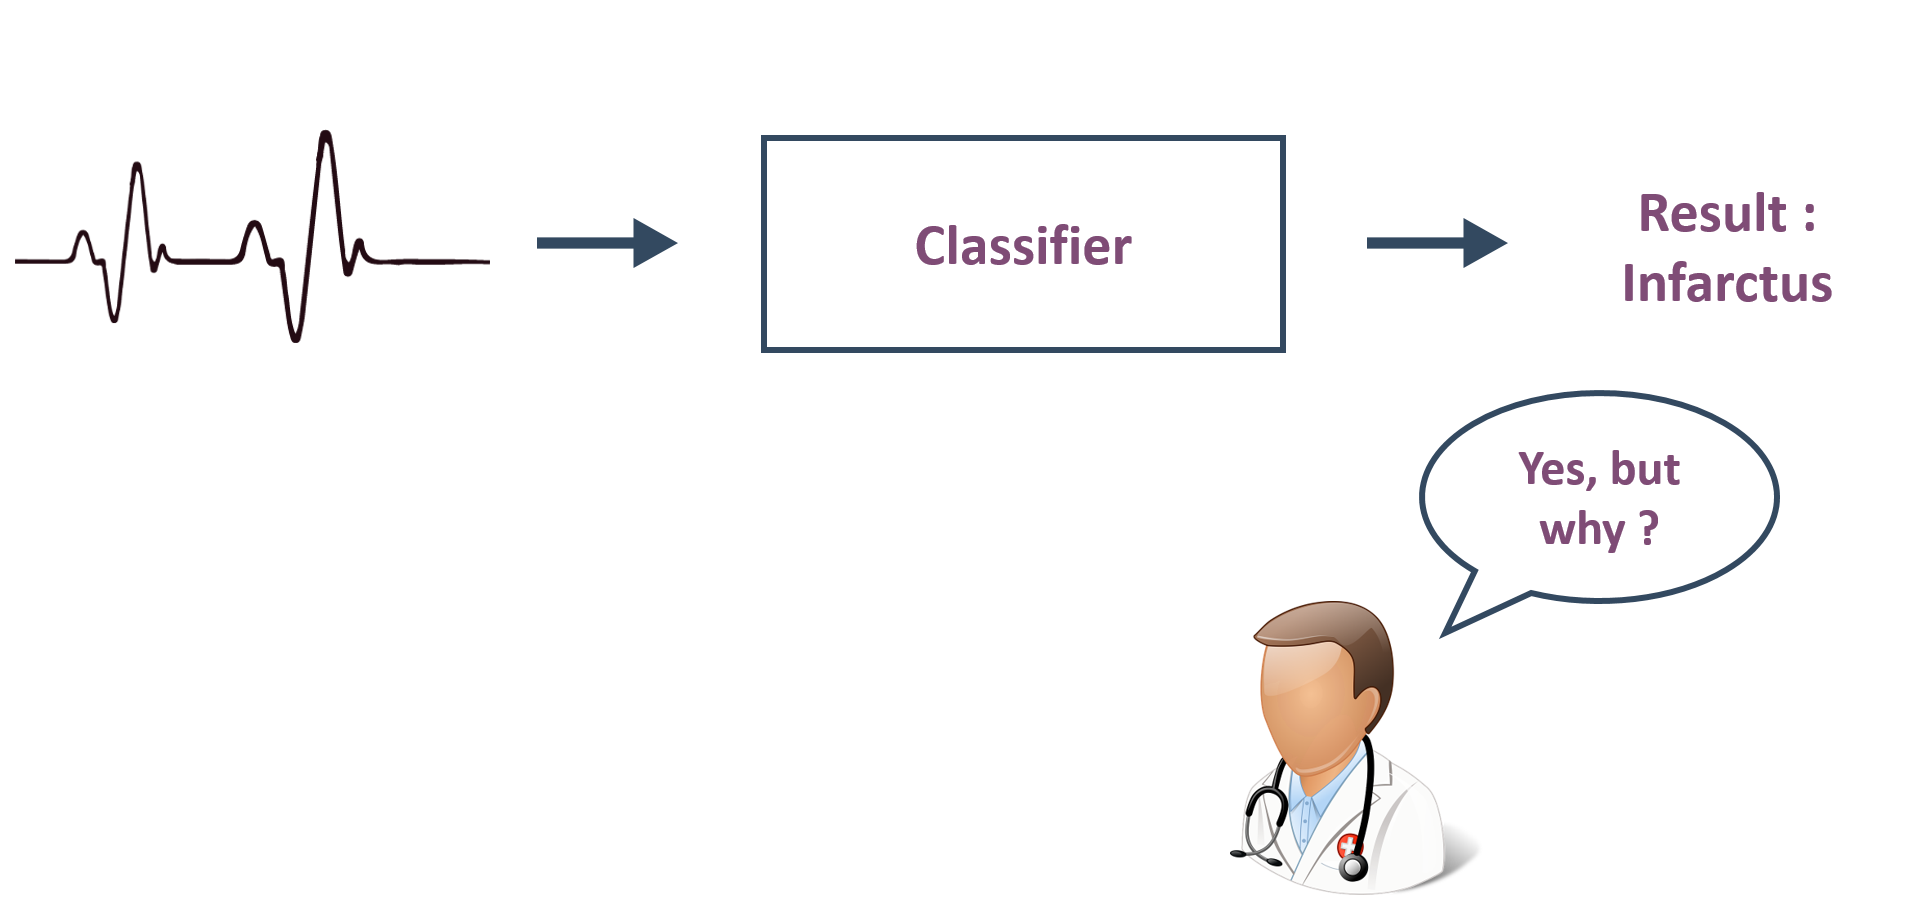
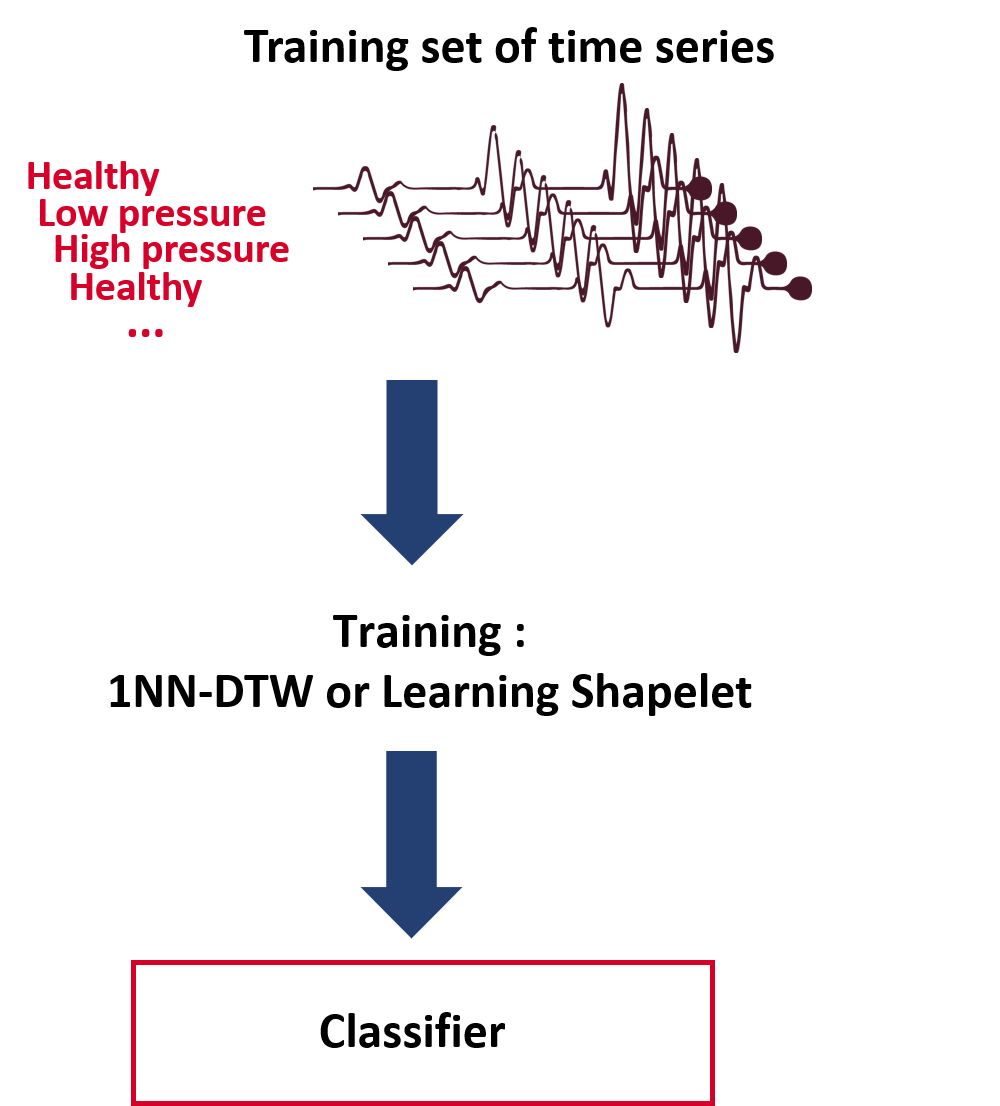
Once a classifier has been trained and saved, it can be used in order to classify a new time series. A user can import a saved classifier and the time series (s)he wants to classify.

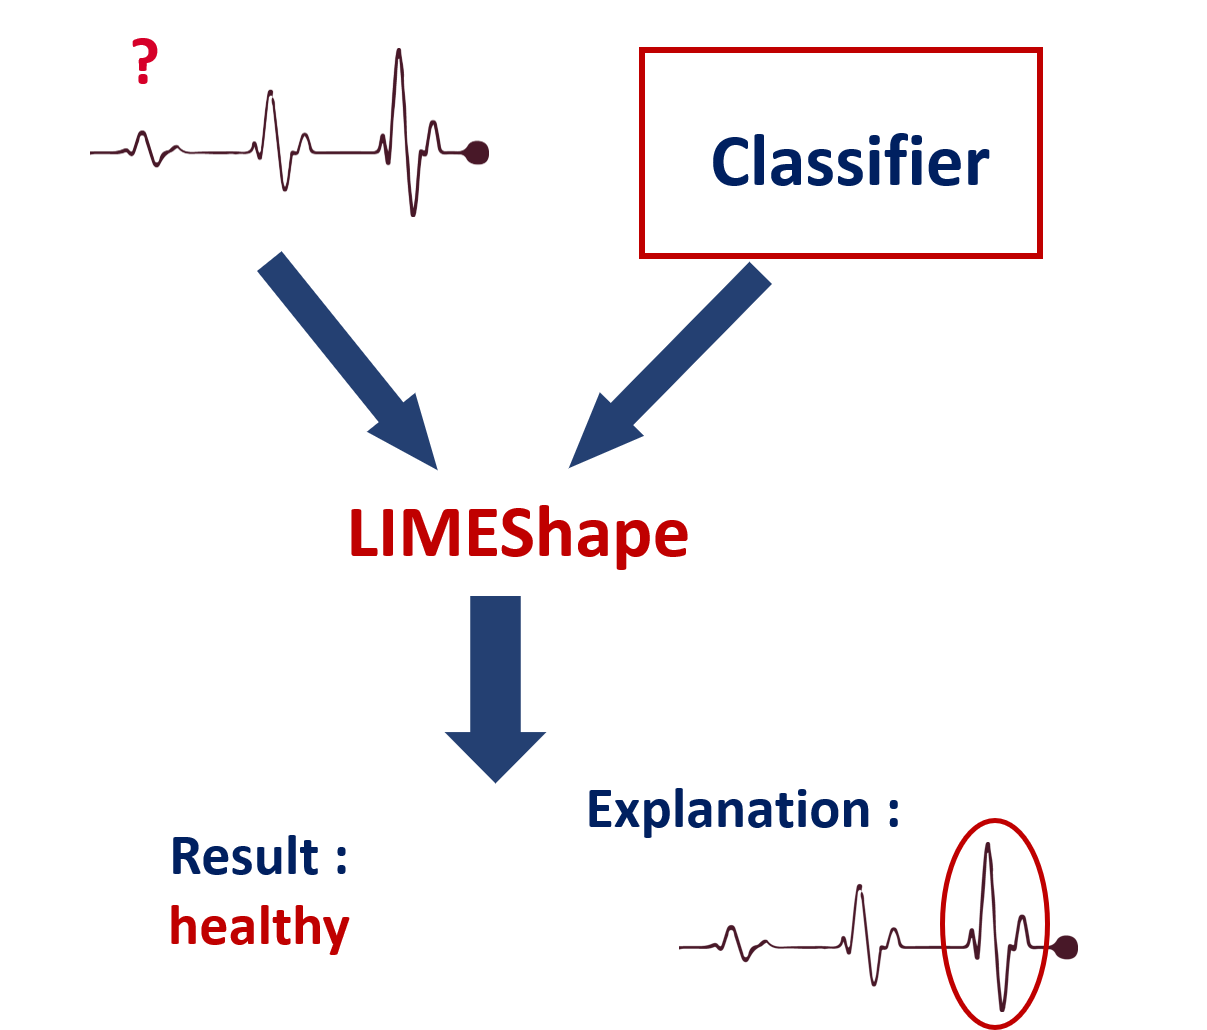
TSExplanation will then use the imported classifier to classify the time series. After doing so, it will display the choice of classification and the explanation of this choice. This explanation is generated by an adjustment of the algorithm LIME : LIMEShape, an algorithm dedicated to the time series processing..

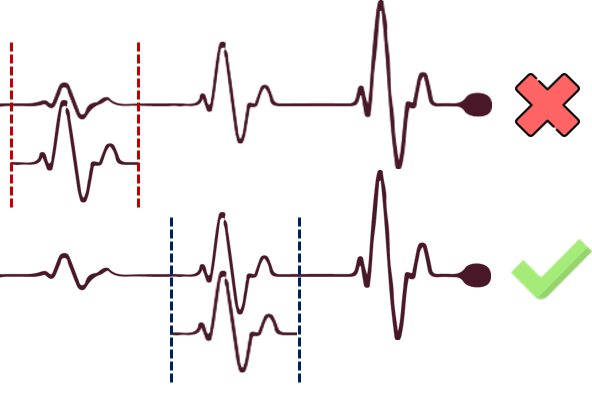
Such an explanation is displayed in the form of a graph. The time series parts which contributed to the classification the most will be colored in green as the ones which contributed the least will be colored in red.

Therefore, a user can see the different parts of the time series which allowed the tool to make a decision. As a consequence, a user can judge by (her)himself the work that TSExplanation has made and therefore trust his(her) tool.

The graphical interface

The 4 tabs of the following image are interactive. This allows to visualize the features of TSExplanation better.
It is possible to display an explanation example by clicking on the "Executer" button in the tap "LIME".

Our team


Our 8-student team has been managed by Maël Guillemé, researcher at the IRISA and employed by Energiency, and by Laurence Rozé, teacher at the INSA and researcher at the IRISA.