Smart Scan

Most of the state-of-the-art methods applied to time series classification consist of deep learning methods whose result is difficult to explain. This lack of explainability is a major drawback, because many real-world applications involve critical decisions such as in the medical field. A lot of work has been done in the last few years, but not much for time series.

- Application -

Counterfactual Explanation

Development of a counterfactual explanation algorithm for time series.

Graphic Interface

GUI allowing the visualization and manipulation of time series, using the previous algorithm.

- LEFTIST -

Updates and additions

Work on the classification explanation tool developed by the research team LACODAM.

- Application -

Counterfactual Explanation

    The objective is to adapt a counterfactual explanation classification algorithm to time series. A counterfactual explanation is an explanation describing what changes would have to be made for the example to be placed on the other side of the classifier's decision frontier. In the image opposite, the image (a) has been classified as a "5", and its counterfactual (b) shows what changes need to be made to reach the nearest class, "6".
This part of the project consists of research and reading of many articles related to this topic.
Counterfactual Explanation for Machine Learnig
ALIBI Documentation

Take a look inside

Graphic Interface

    This application allows loading time series in order to visualize them and to apply treatments to them. It is possible to apply and train classifiers on sets of series to determine their classes but also to determine their counterfactuals using the algorithm described above. Other options are available such as the calculation of different distances between the series and its counterfactual. All results can be saved by the user. The application is developed with PyQt5 and pyqtgraphics.

Take a look inside

- LEFTIST -

Updates and additions

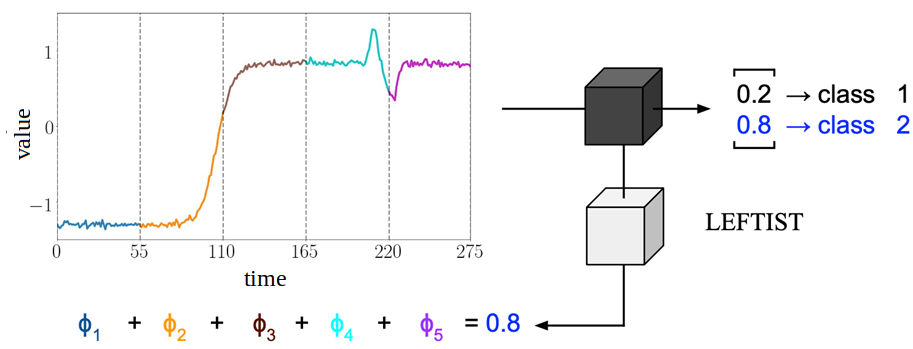
    LEFTIST is a tool that allows to explain a time series classification by giving a coefficient to each segment between -1 and 1, which helps to identify the part(s) of the time series that are most decisive in the choice of classification. This tool was developed with an old version of python (3.6) and used outdated libraries, which made its use chaotic. Thus, we updated the tool with python 3.7 and made it easier to use. Moreover, the only segmentation available in LEFTIST was a uniform segmentation (we cut into n segments of equal size), which is not necessarily relevant. Therefore, we added two new segmentations SAX and Matrix Profile (which are based on pattern recognition).

Safe and reliable

Partners