Bowtie++
Web application for risk visualization
Bowtie++ is an application for an easy creation of risk analysis diagrams, called Bowtie diagrams. Bowtie diagrams are used to quickly estimate the risk related to an unwanted event. The causes and consequences of an unwanted event are displayed in order to implement a strategy to prevent, or, at least, limit, the damages it may cause.
Project context
Risk analysis is an important stage of a project lifecycle. It allows to identify potential malicious actions, i.e., security threats, as well as possible safety issues related to accidental causes. The primary motivation of the Bowtie++ project was the lack of an open-source tool allowing to model and analyze in a uniform framework the safety and security risks.
Safety/security duality
The term safety covers the risks related to accidental causes, whereas security refers to those related to malicious actions.

Safety

Security
Project's objectives
With this project, we aim to deliver a modeling application to create risk analysis diagrams, easy to deploy on a wide range of formats. To obtain a modern and secured solution, Bowtie++ uses the following three technologies:
Docker Containers
Vue.js Components
Django REST API
Functionalities

Risk calculation

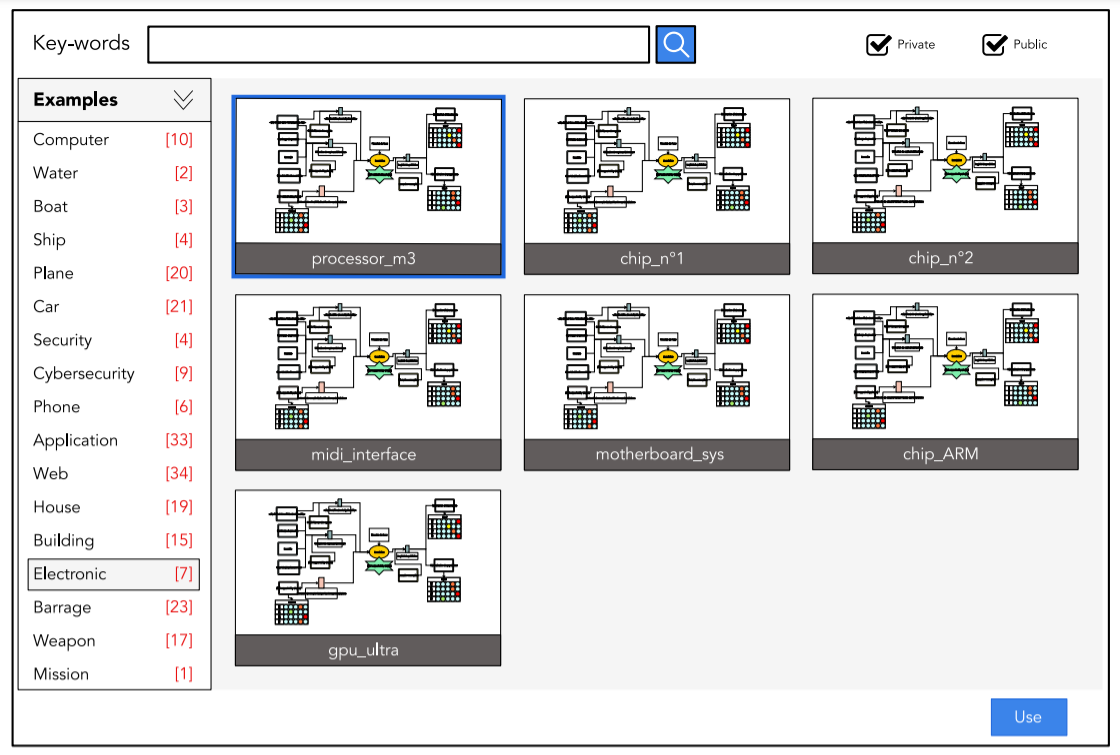
Statistical analysis
Secure application

Demonstration
Our team
Maxime Durand
Scrum master
-
Back-end Team
Mihail Kirov
Product manager
-
Back-end Team
Eddine Moulkaf
Team leader
-
Back-end Team
Nathan Gérard
Report manager
-
Front-end Team
Yugo Cartron
Communication manager
-
Front-end Team
Clément Chavanon
Quality manager
-
Front-end Team
Aminata Sissokho
Happiness Manager
-
Front-end Team
Barbara Fila
Daily supervisor
-
Researcher at IRISA
Per Håkon Meland
Project initiator
-
Researcher at SINTEF Digital
About
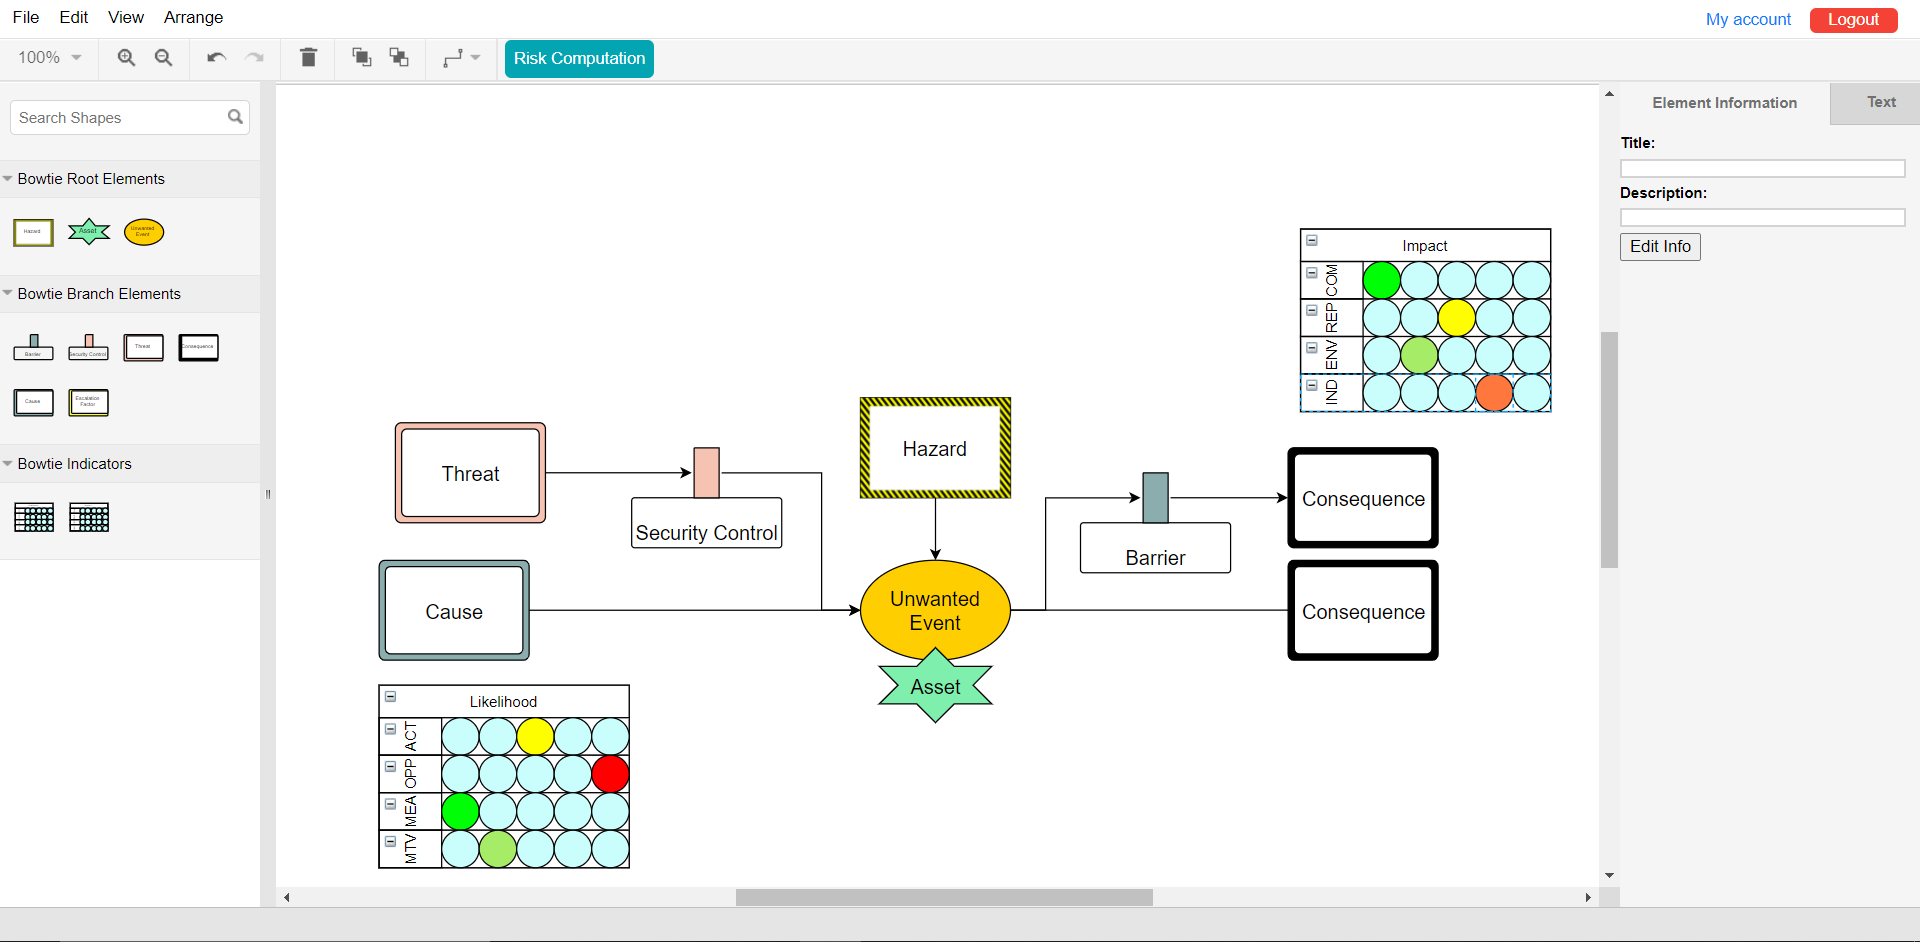
Bowtie diagrams
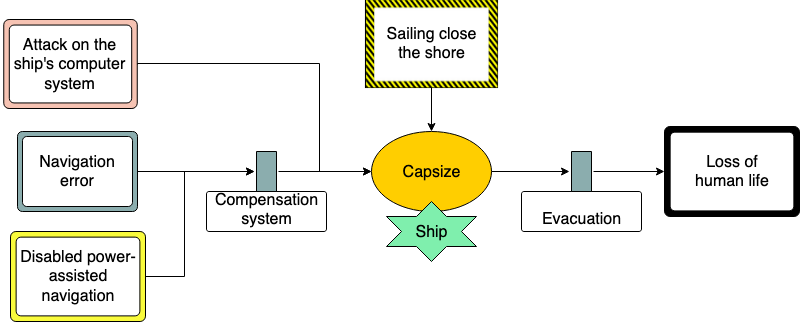
A Bowtie diagram as its name suggests has the form of a bowtie. The center of the diagram describes an unwanted event. On its left side are situated the potential causes of the event and on its right side are situated its consequences. The most significant advantage of a Bowtie diagram compared to other risk analysis models is that it represents in a comprehensive and intuitive way the relation between causes and consequences of an unwanted event.
Hazard, the danger inherent to an activity.
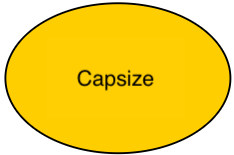
Unwanted event, what we are trying to represent through this diagram.
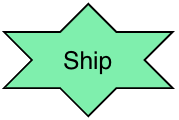
Resources, all infrastructures linked to the unwanted event.
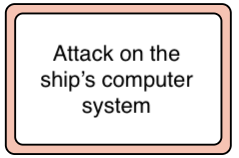
Threat, security risk.
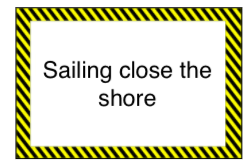
Cause, safety risk.
Prevention barrier, prevents the progress of causes and/or threats.
Escalation factor, factor countering a barrier.
Consequence of the unwanted event.
Mitigation barrier, mitigates a consequence of an unwanted event.